By Ashley Preen
August 2, 2021

If you’ve ever tried to do your own accounting, you’ve no doubt run across the plethora of financial reports and statements that exist. But there are three financial statements which are more important than all others. They are:
Like all things in the financial world, accounting terms can cause confusion for outsiders. But understanding them is not as complicated as it might seem. All you need is somebody to explain them simply without getting into more industry jargon.
In this article, we’re going to talk about the three most important accounting reports, as well as discuss how these are used by managers, investors, and financial experts to make solid business decisions.
Let’s get going!
The P&L Statement is also known as the Profit & Loss Statement. In the USA, it is more commonly called an Income Statement.
But what is a P&L Statement?
A Profit & Loss Statement shows a company’s earnings and expenditures over a period of time. This period of time is arbitrary but is usually a quarter or 12 months.
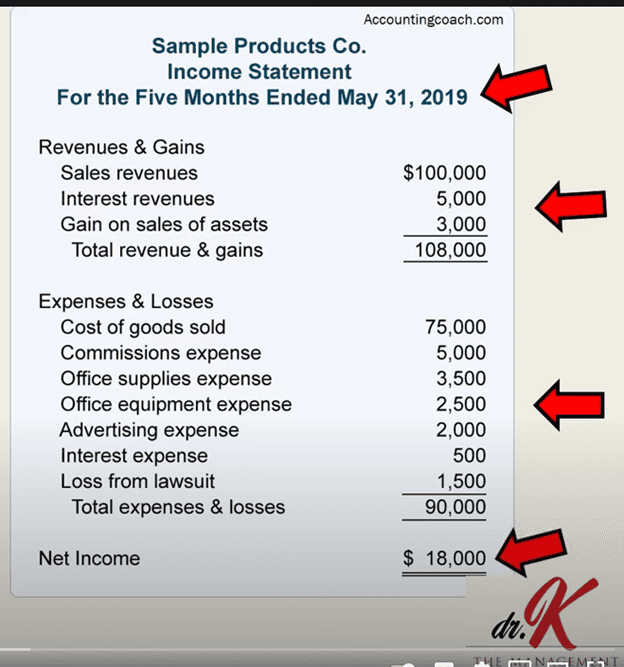
Let’s look at an example of an income statement as shown on this video from AccountingCoach:
At the top of the statement, you’ll notice the time period, in this case, the five months before 31 May.
After that, the statement lists out all revenue and gains.
Following revenue and gains, the statement shows all expenses and losses.
By subtracting the losses from the gains, we arrive at a Net Income number.
Important: Profit & loss statements are prepared on an accrual basis, which means that they are prepared according to what has been invoiced but not necessarily paid yet. (If you need to know more about the Accrual method of Accounting then check out our post on the Basics of Accounting for Small Businesses.) This is different to a Cash Flow Statement which shows actual cash on hand.
There can be many more line items under expenses and revenue than shown above. Many popular accounting tools will take care of these line items automatically for you.
Before these tools existed, this was usually the job of a competent accountant. Although, it is never a bad idea to get an accountant to look over your books before submitting any taxes. Sometimes, a sharp-eyed accountant can end up saving you money on your tax bill by finding expenses that you didn’t know could be claimed.
The cash flow statement gives insight into how a business obtains cash and what it spends it on. Unlike the P&L Statement, a cash flow statement works on the cash basis of accounting, meaning it only counts values when cash has physically moved in or out of the company.
Companies might look profitable on paper in a P&L Statement but have zero cash on hand. In big business, where invoices can have payment dates set as far away as 90 days, this is rarely a problem. So long as your P&L shows that you have the revenue to cover expenses, a company can take out loans to continue to do business despite not having matching cash in the bank.
But, as was revealed during the COVID-19 pandemic, a lack of cash on hand proved catastrophic for many businesses. As much as 86% of small businesses in the USA said they could not survive more than two months without external revenue because of their lack of cash on hand.
Cash is the lifeblood of a business. A business that overexposes itself and does not take into account the cash it has on hand will have a harder time surviving dry spells.
A cash flow statement consists of three main parts:
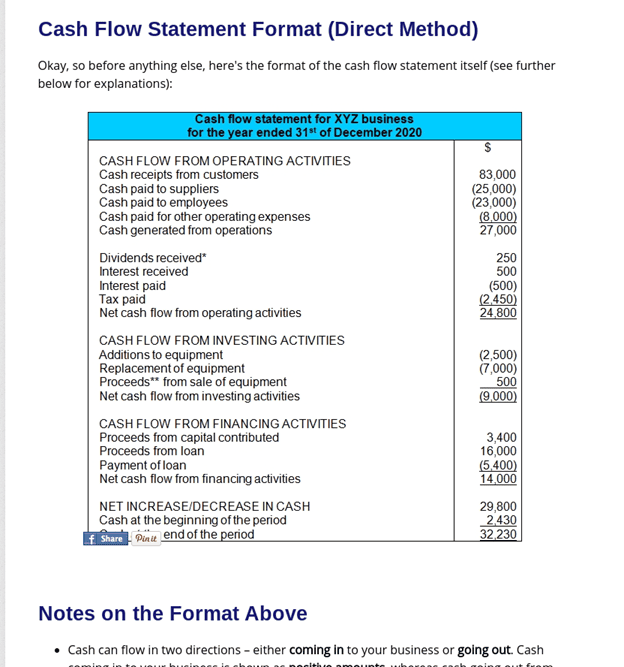
Cash from operations is, roughly, the cash received from product or service sales, cash paid to salaries and taxes, and cash paid to suppliers. Most mature companies should have their cash flow from operations in a net positive.
Items that go in the investing section include:
Generally speaking, mature companies in good health would have a net negative in this section of the cash flow statement, showing that they are acquiring assets and subsidiary companies.
Shareholder dividend payments (cash out), loans or investments received (cash-in), and loan principals repaid (cash out) are all included in this category.
Unlike the other two sections, cash from financing can be either negative or positive.
Unlike a P&L Statement, the Balance Sheet shows a company’s financial standing at a specific point in time as opposed to over a period of time.
The Balance Sheet is one of the mandatory reports required when submitting your annual company accounts in the UK. (The P&L is only mandatory for large companies.)
Essentially, a balance sheet shows what a company owns (assets) and what it owes (liabilities). Assets are shown on the left of the balance sheet and liabilities are shown on the right.
Think of the balance sheet as a snapshot of a company’s financial position. Whereas the cash flow statement and P&L show flow in and out of a company over a period of time, the balance sheet is static and gives an overall picture.
In the left column (assets) of the balance sheet, items are subdivided into:
Without getting too technical, “current assets” represent assets that can be converted into cash within a year. We say that these assets are more “liquid” than long-term assets.
Examples of current assets can include:
Examples of long-term assets can include:
The right column of the balance sheet (liabilities) breaks down into:
Shareholders’ equity fits into the right-hand column because it is money that must be paid to shareholders. The shareholders “own” a portion of the company (equity = ownership) and so the amount shown is what they are owed.
Current liabilities are items that must be covered within the next 12 months. These can include:
Non-current liabilities can include:
This report is called a balance sheet because everything in the left column (assets) must equal the total of everything in the right column (liabilities and shareholders’ equity), resulting in an equation of:
Assets – Liabilities – Equity = 0
Or, more familiarly, it is represented as the accounting formula which is:
Equity = Assets – Liabilities
(For a detailed explanation of the accounting formula, check out our in-depth article on the basics of accounting.)

A “trial balance” is not a financial report but is an essential accounting tool to ensure that the company’s reports are accurate.
A Trial Balance is essentially one worksheet. It is all the values of all the company’s ledgers, put into two columns—a debit and a credit column. The total of both columns should equal each other or balance. If they don’t, then the books have an error in them and it’s time to get busy finding it!
Back in the day, preparing trial balances was a monstrous manual task that was eventually made easier through the introduction of spreadsheets. But, even then, it was prone to plenty of human error and took hours or days to complete depending on the size of the business.
This has been simplified tremendously through the introduction of modern accounting software which does all of it automatically. Now, errors can be spotted easily and more frequently because these accounting tools work constantly in the background to ensure that the accounts balance.
In a corporate context, trial balances are prepared periodically to ensure that the books are in order. If they are not, the errors need to be discovered and remedied rapidly to avoid penalties from HMRC for false reporting.
The trial balance only looks for mathematical errors, not for errors in improperly assigning categories to transactions. (One of the ways that embezzlers work is to fraudulently categorise transactions while still keeping the values “balanced”.)
Trial balances are ideally prepared before creating all the required financial reports.
In addition to checking that the credit and debit columns balance, it’s also important to compare those values to their usual values and look for any anomalies. If a company usually has credits of £10,000 per month but suddenly has £100,000, it’s possible that someone typed in an extra zero.
The three most important financial statements are also the main ones that investors look at. These statements are also required when putting together a complete business plan. Banks also require one or more of these statements before approving any loans.
Although looking at the statements in themselves offers deeper insight into a company’s workings, there are also advanced mathematical formulae that can be used to determine key financial ratios for ascertaining a company’s viability.
Here are some of the ratios used when analysing financial statements:

The asset turnover ratio determines how efficient a company is at using its assets to generate revenue.
The formula for asset turnover ratio is:
Asset Turnover = Total Sales Over 12 Months ÷ Average Asset Value Over 12 Months
The formula for the Average Asset Value over 12 months is:
Average Asset Value = (Total Assets at Start of Year + Total Assets at End of Year) ÷ 2
If the asset turnover ratio is high, it means a company is very good at using its assets to generate income. If it is low, it means it is using its assets poorly to generate income.
A low asset turnover ratio could lead to any of the following possible remedies:
Improving the efficiency of assets doesn’t mean that the asset itself must be changed. For example, if you have a building in a prime location with a high asset value, but the branch is not selling enough goods, you could invest in staff training or better marketing.
This ratio is obtained from values in the balance sheet.

For companies who extend credit to clients (“Hey, put it on my tab!”) the Receivables Turnover Ratio shows how efficient the company is at transforming that extended credit into hard cash.
A high receivables turnover ratio means the company is good at collecting its debts. But sometimes a high ratio could mean that a company is too aggressive at collecting its debts, leading to a reduced bottom line because potential customers choose not to buy. As with all ratios, the values must be studied in relation to other factors to provide an overall view.
The receivables turnover ratio can be used to compare a company with competitors in the same industry, or also to compare itself to previous quarters or years.
The formula for Receivables Turnover Ratio is:
Accounts Receivable Turnover = Net Credit Sales ÷ Average Accounts Receivable
And the formula for Average Accounts Receivable is:
Avg Accts Receivable = (Accts Receivable Beginning Value + Accounts Receivable End Value) ÷ 2
The “beginning” and “end” values refer to a specific time period such as 12 months or a quarter.
This ratio is obtained from values present in the balance sheet.
The gross margin of a company determines how much money it is keeping for every £1 it sells.
The formula for gross margin is:
Gross Margin = Net Sales − Cost of Goods Sold
The Net Sales value is the total amount of revenue generated from sales. The cost of goods sold is all the costs associated with making those sales, such as labour costs or costs of materials.
By determining a company’s gross margin, we can determine how profitable that company is.
But we can take it a step further and calculate the gross margin ratio. This will give managers a ratio that can be used to compare one period to another, to determine if the organisation is becoming more efficient.
The formula for gross margin ratio is:
Gross Margin Ratio = Gross Margin ÷ Net Sales
This ratio is obtained from values sourced from the P&L statement.
There are many other useful ratios that finance professionals can use, all obtained from values in the three financial statements we discussed above.
By utilising ratios, finance professionals are able to obtain deeper insight into a company’s overall viability.
Traditionally, financial reports were prepared by an accountant. This was not a legal requirement, it was just easier. These days, however, online accounting software does much of the legwork to prepare financial statements so that accountants can now focus on more sophisticated services, such as how to legally lower your tax bill.
There are certain legal rules regarding who signs off on which documents before sending them to HMRC, and who officially “prepares” certain financial documents. But regardless of who is legally responsible for them, the manual labour of getting them done is far less these days than it once was.
The most important financial statements in a company are the P&L statement, Cash Flow Statement, and Balance Sheet. These statements are looked at by investors, banks, and managers to make financial decisions. Many mathematical ratios exist to help finance professionals and managers understand a company’s viability.
We hope this guide has helped you understand the three most important financial statements better. And, if you ever need any assistance in preparing these statements for your business, please don’t hesitate to contact us!

Pearl Accountants are a team of specialists that can assist you with all your accounting and taxation needs in one place. From the first contact through to completion, our aim is to keep you informed and provide a simple, affordable solution for all your financial needs.

We Guarantee to never miss a deadline or your money back
© 2024 Pearl Accountants. All Rights Reserved
Registration No. 07078392
 020 8582 0076